The Zone Missed by 13 Points. The Off-Plan ETH Long Paid 10,182 USDT
Trades
| # | Side | Entry | Exit | Size | P&L |
|---|---|---|---|---|---|
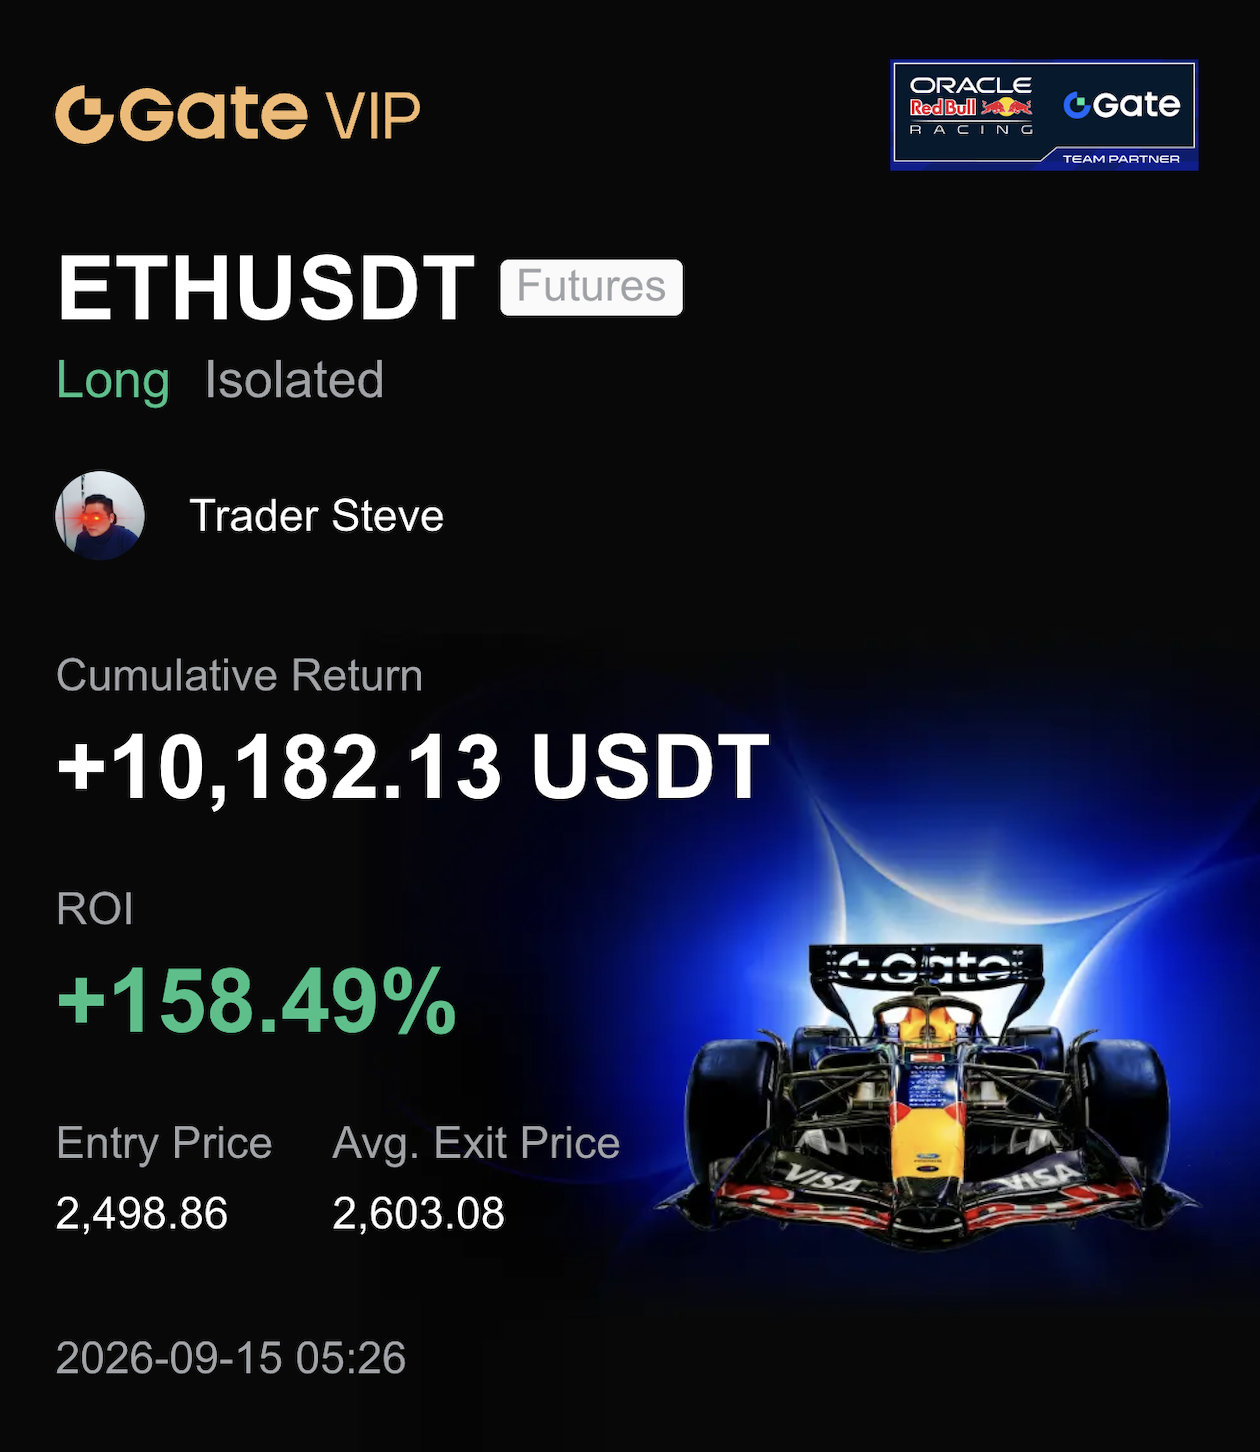
| 1 | LONG | 2498.86 | 2603.08 | +10,182.13 USDT +158.49% | |
| Total Trades 1 · W/L 1/0 | +10,182.13 USDT | ||||
스샷 1장 = 1건, 단위 USDT 단일. 카드의 Cumulative Return 값을 그대로 썼다(수수료·펀딩 반영 여부는 카드에 표기 없음). 진입 2,498.86 은 리포트 진입존 2453~2473 밖이며, 콜 자체는 발행 후 최저가 2486.29 로 미체결 — 개인 손익과 콜 성과는 별개로 표기. 레버리지 약 38배는 ROI÷가격변동으로 역산한 추정치.
View original analysis report →
The receipt
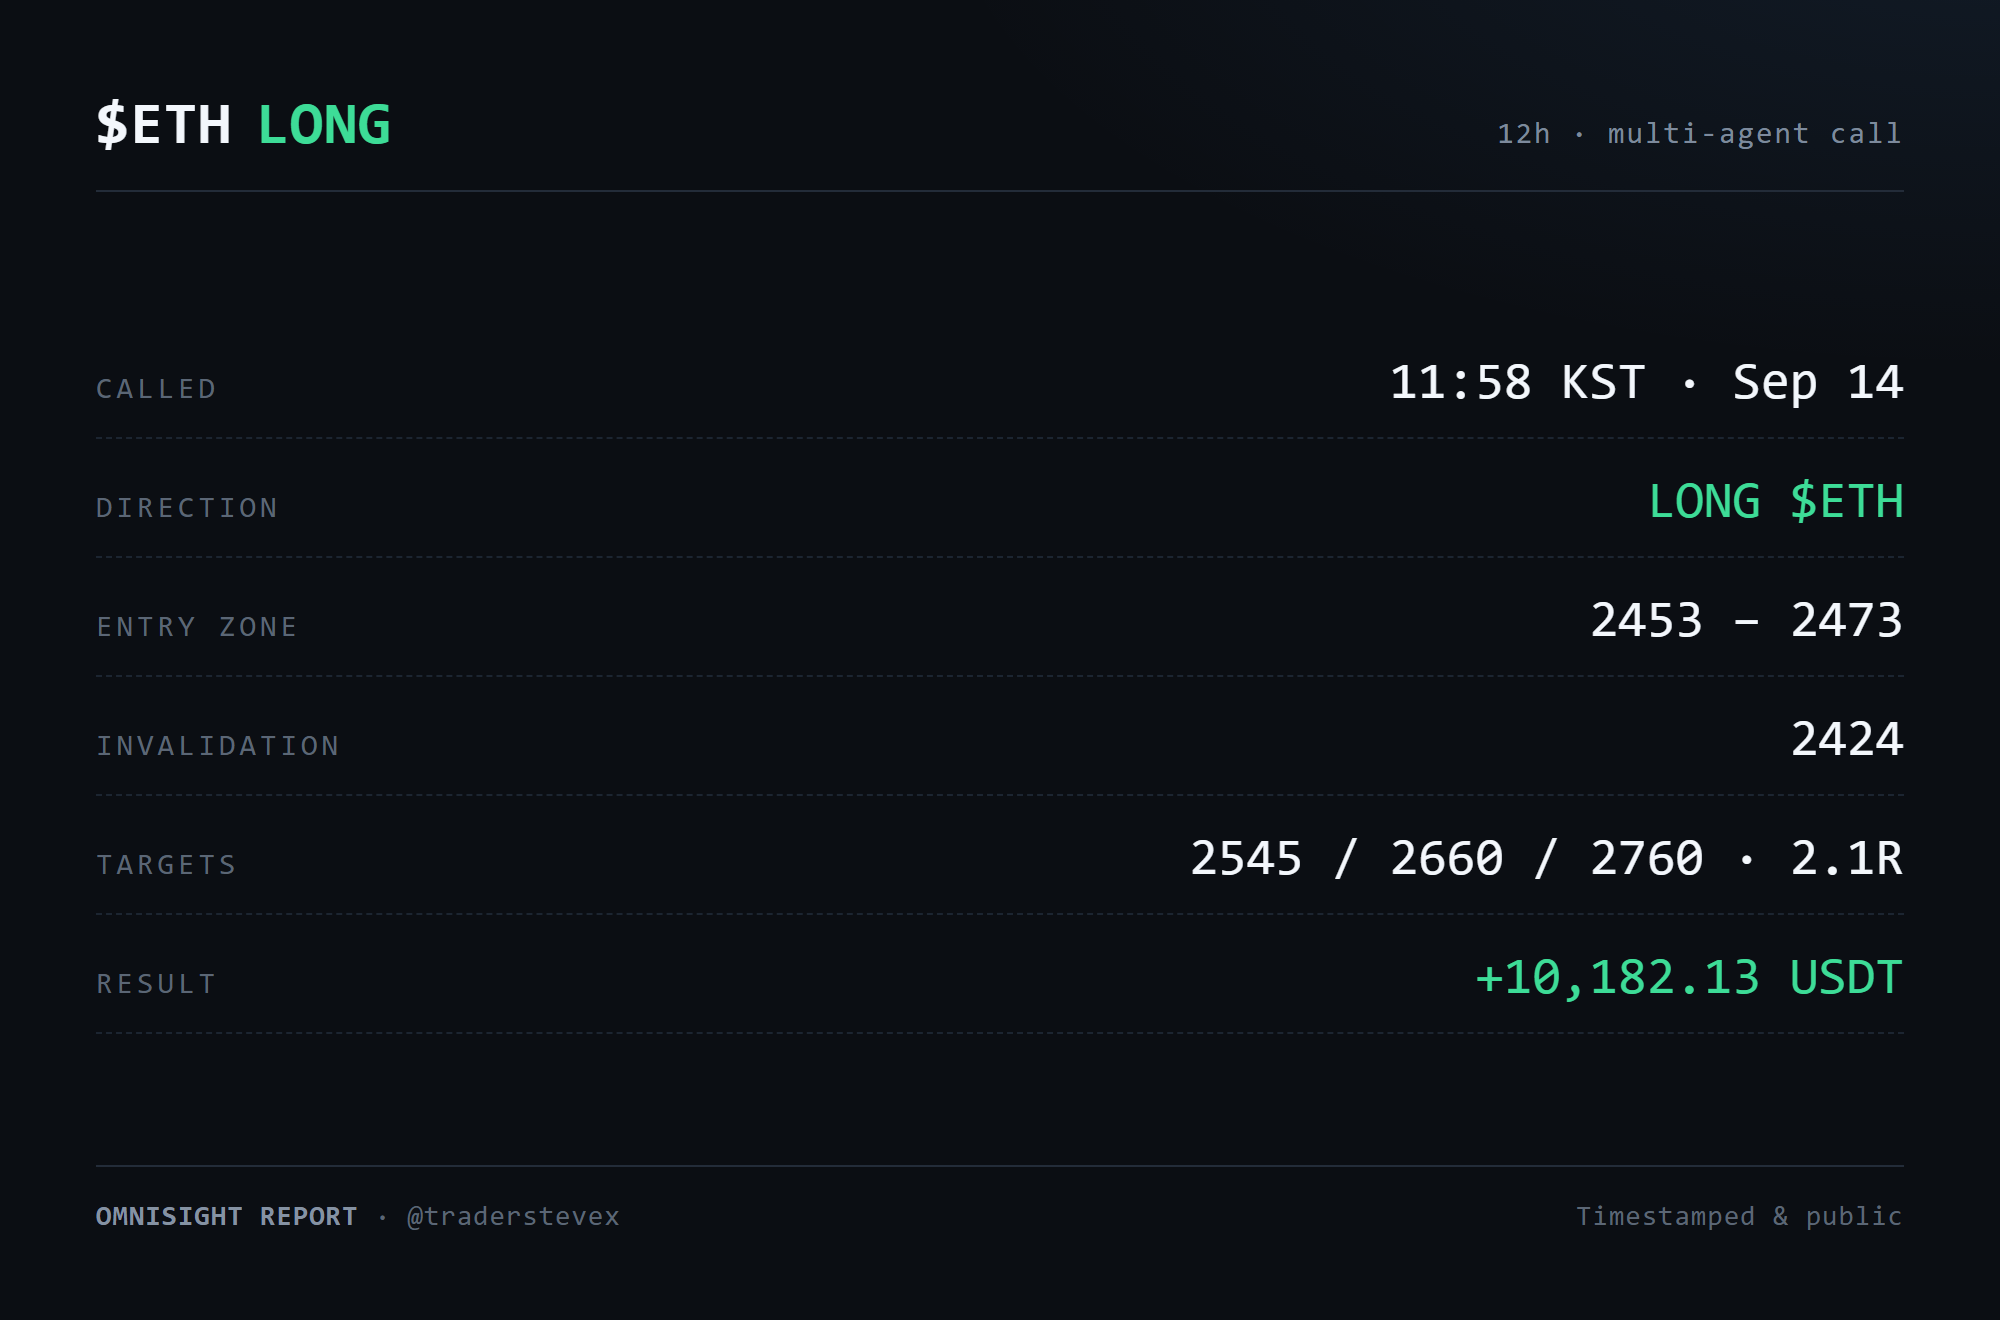
The report went out at 11:58 KST on Sep 14 with ETH at 2500.20: long, limit zone 2453–2473, stop 2424, targets 2545 / 2660 / 2760, 2.10R, confidence 48. The lowest print afterwards was 2486.29 at 13:00 UTC, 13.29 points above the top of the zone; T1 at 2545 traded at 19:00 UTC and one hourly candle wicked to 2614.78 at 20:00 UTC. As a call, that is a no-fill and it scores as no trade. My own account is a separate line: Gate futures long, isolated, entry 2,498.86, average exit 2,603.08, closed 05:26 KST Sep 15, realized +10,182.13 USDT (ROI +158.49%).
The setup
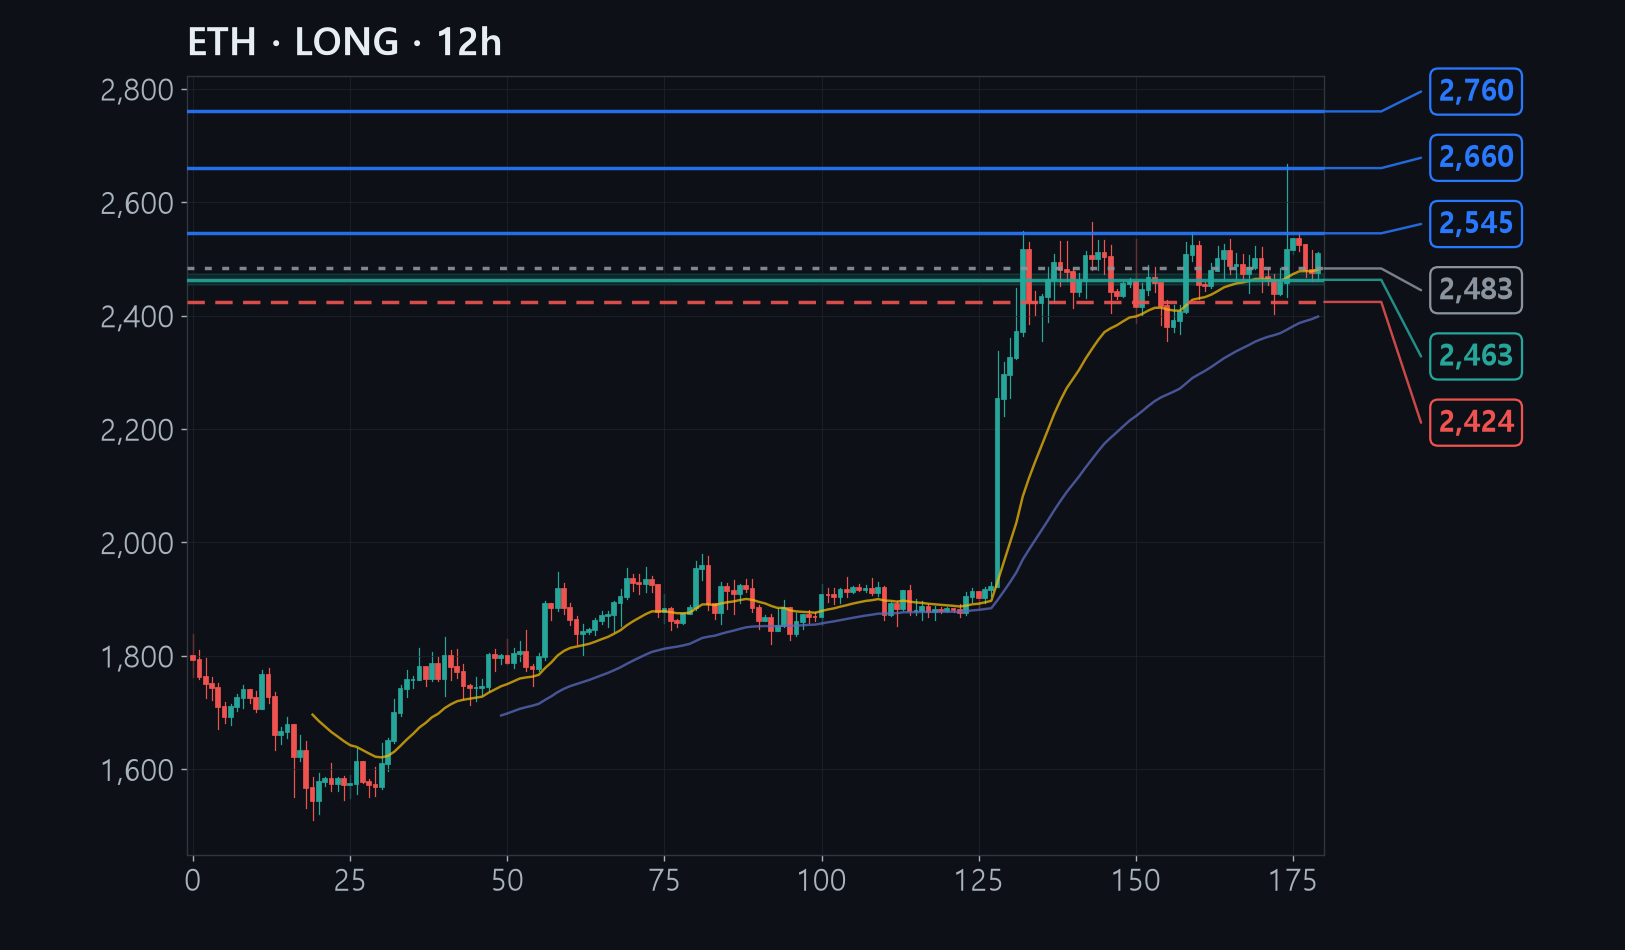
At publication ETH had spiked to 2666.38 on Sep 11 and spent three days sliding to 2460.84. The chart could not tell a pullback inside a trend from the first leg of a failed breakout, and confidence 48 said so plainly. Structure leaned long, with EMAs stacked on 4h, 12h and 1d and lows stepping up 2355.05 → 2403.55 → 2433.01 → 2460.84, while macro leaned cautious: a Sep 16 FOMC hike about 80% priced, the 10-year near 4.97%, Bitcoin ETFs on a fourth day of outflows. The report spelled out that buying near 2500 was worth 0.6R and moved the order lower.
The signals
First, the Sep 11 spike was a liquidity sweep rather than a top: it cleared the stops above the equal highs at 2548.64 / 2565.0 / 2547.47 on 366M volume, twice the 20-day average, closed at 2515, and the 12h bars that followed carried only 35M → 40M → 64M → 77M. Second, the Sep 13 low at 2460.84 held the exact midpoint (2460) of the box that had ruled since Aug 21. Third, the vote split 4 long, 2 short. The divergence model dissented on a daily regular bearish divergence, RSI 63.3 at the 2666.38 high against 77.5 at the lower 2565.0 high, and the judge kept it in the file: the signal had already delivered −7.7% while lows kept rising, so it was used to cut confidence and targets rather than flip direction.
What would have killed it
The call's structural line was a 12h close below 2433.01, the spike origin, and the actual low of 2486.29 never got near it. The real danger sat in my sizing, not the chart. A +4.17% price move producing +158.49% ROI implies leverage of roughly 38x, and an isolated position that size would be liquidated somewhere in the mid-2440s, before the report's 2424 stop could ever trigger (an estimate, not an exchange figure). The post-call low at 2486.29 was 12.57 points under my entry, and a single repeat of the Sep 10 spring to 2403.55 would have erased the trade whether or not the direction was right.
The lesson
A zone missed by 13 points is neither a win nor a loss for the call; it is a no-fill, and it stays a no-fill on the scoreboard even though T1 traded the same day. Two misses in a row, 5 points and then 13, say the zone is being anchored one notch too deep in a market that keeps printing higher lows. The reusable rule: while higher lows hold, assume the next pullback stops above the last low and price the zone accordingly, or accept no-fills as a cost of the method. And never grade a call with personal P&L, because the entry that made money here was the one the report said not to take.